Dear Client,
Hoping this update finds you and yours doing well. As almost prophetically referenced in our last update, the market continued to provide gyrations that most investors are almost becoming accustomed to as the new normal. Although the quarter started with a double-digit drop in equity markets, those losses were regained in short order, moving the S&P 500 to all-time highs near the end of the quarter. International equities have performed even better due to a weakening dollar and solid performance with the EAFE up VAR1%. While Small Caps have lagged as measured by the Russell 2000, down VAR2% since the first of the year. Bonds are holding steady with the Bloomberg Aggregate Bond Index up VAR3%.
Geopolitical Unrest
Activity on the geopolitical front has been unprecedented with the ongoing Russia/Ukraine war, middle east conflict for Israel on multiple fronts, along with our most recent involvement in helping to diminish the growing nuclear threat from Iran. While many would believe conflicts of this nature would bring great uncertainty to the markets, it seems the opposite is true. As indicated by market performance and sentiment indices, the successful outcomes brought temporarily higher levels of confidence in the financial markets and the overall economic outlook.
While it seems our broken world has always had this type of conflict, to assume wars and conflicts of this nature are finally behind us is obviously unreasonable. It has been present for thousands of years, and yet the death and destruction caused by these conflicts is truly heartbreaking. Our hope and prayer is that each of these wars/conflicts will be resolved soon, with optimal outcomes that will bring peace to these regions of the world.
Tariffs and Trade Agreements
In early April the markets responded to the tariff proposals with a swift correction, dropping over 10% in just a few days. The thought being that higher tariffs would impede economic growth and create high levels of inflation. Subsequently those tariff proposals softened, allowing the market to quickly recover losses. The deadline for trade agreements to be finalized is just around the corner and we wouldn’t be surprised to see some daily gyrations from the headlines to follow. Trying to determine if the tariff outcomes will be positive or negative in the short term and/or long term is virtually impossible.
However, we do believe that being very selective in times like these can help mitigate downside risk and enhance long-term growth as well. We are closely monitoring equity valuations, sector weightings and overall asset allocation. We feel your portfolio is optimized for the best possible outcomes amid short- and long-term tariff/trade uncertainty.
Economy (Soft and hard Data)
“Soft data” is information pertaining to how individuals “feel” about things, often referred to as sentiment indices. Over the last couple of weeks many of these indices, which had been trending to historically low levels, have turned to a more positive outlook. For example, the AAII Investor Sentiment Survey showed its bullish outlook rising from lower levels to its long-term average of 37.5%, while the bearish outlook dropped from 41.4% to 33.6%. The NFIB Business Optimism Index posted a solid 98.8, marking the first increase since late 2024, and the Consumer Sentiment Index also rose for the first time in 6 months.
While these sentiment indices provide some encouragement about how people “feel” about the economy moving forward, they don’t really tell us anything about the direction of the market. Unfortunately, sentiment indices can provide a temporary feel good, causing investors to look past underlying concerns that should be considered.
Some of the Hard Data trends we are monitoring closely are included in the LEI index. According to the Conference Board of Leading Economic Indicators, “The LEI has fallen by 2.7% in the six-month period ending May 2025, a much faster rate of decline than the 1.4% contraction over the previous six months.” This graph shows the LEI trending more negatively.
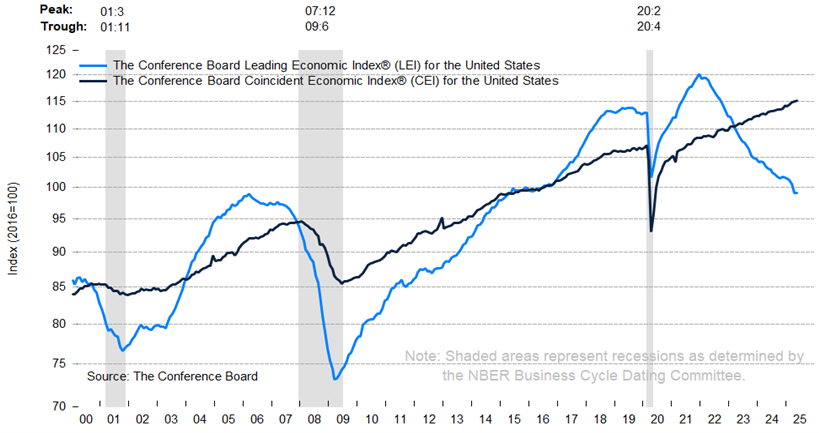
The ten components of the Leading Economic Index® for the US are:
– Average weekly hours in manufacturing
– Average weekly initial claims for unemployment insurance
– Manufacturers’ new orders for consumer goods and materials
– ISM® Index of New Orders
– Manufacturers’ new orders for non-defense capital goods excluding aircraft orders
– Building permits for new private housing units
– S&P 500® Index of Stock Prices
– Leading Credit Index™
– Interest rate spread (10-year Treasury bonds less federal funds rate)
– Average consumer expectations for business conditions
The four components of the Coincident Economic Index® for the US are:
– Payroll employment
– Personal income less transfer payments
– Manufacturing and trade sales
– Industrial production
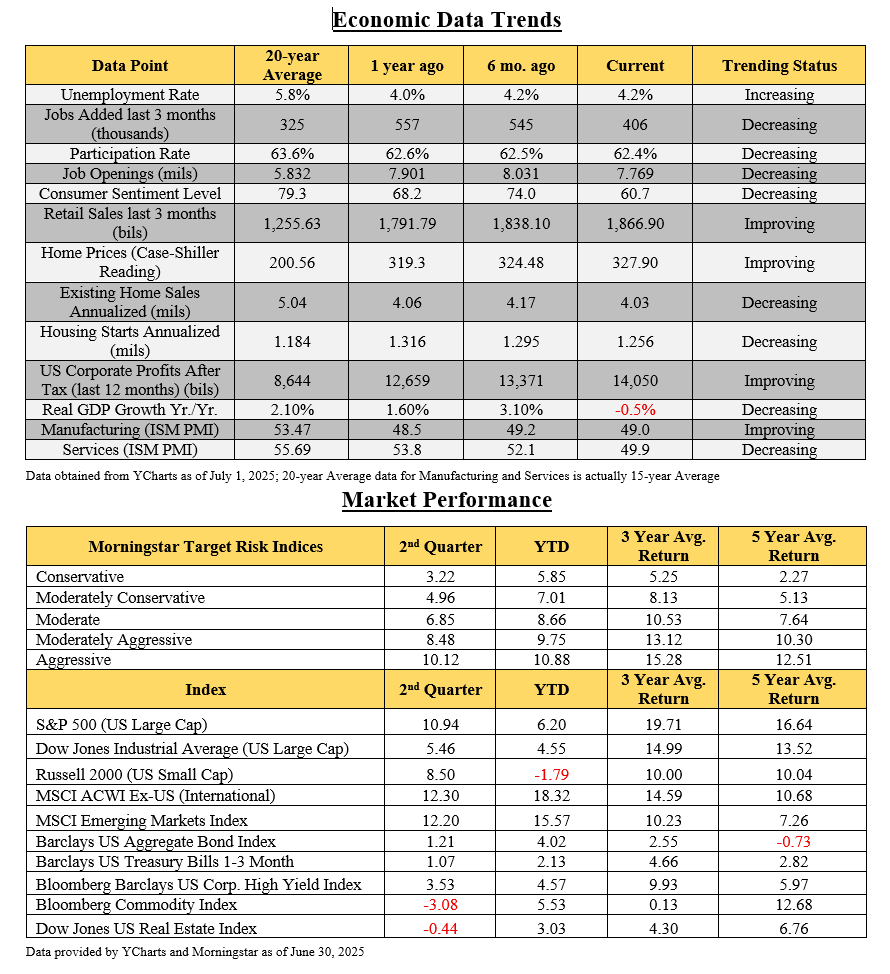
While it is clear that the Leading Economic Indicators are contracting, the Coincident Economic Index does provide a bit of encouragement. Our biggest areas of concern include employment, housing, services, manufacturing, and overall GDP, which have either been softening or maintaining lower than optimal levels over the past couple of years. (See attached Economic Data Trends)
Markets
To say the markets have been resilient amid all the previously shared data would be an understatement. After a first quarter correction of more than 10% followed by another even bigger correction in early April, the market has not only regained those losses but currently stands close to all-time highs, and is in positive territory for the year. Not only have investors been rewarded for their patience in US equity markets, but International diversification has helped provide even stronger growth and reduced volatility this year. The weakening dollar along with stronger growth in international developed and emerging markets has rewarded diversification this year. In addition, the case statement for maintaining proper diversification remains strong with the forward P/E of the S&P 500 at 22 and International stocks as measured by the EAFE still trading at a 40% discount with P/Es around 14.5.
While US equity valuations are relatively high, much of that can be explained with the currently high valuations in the Mag Seven stocks we have referenced in previous letters. While the majority of holdings in your portfolio are in US equities, we remain highly sensitive to valuations whereby we focus primarily on value stocks and growth stocks at a reasonable price. We believe this intentionality in security selection is as important as ever when considering the equity risk premium which is currently close to the lowest levels we have seen in 25 years as measured by taking the S&P 500 forward earnings yield minus the U.S. 3-month T-bill yield, which is currently close to a wash.
Your Portfolio
We have been pleased to see solid performance from the majority of our managers, while we continue to closely monitor a couple of managers currently on our watch list. We’ve also been encouraged with the results of your overall portfolio performance in relation to the blended benchmarks as you can see in your enclosed report. Although the ever-present uncertainty of the global landscape persists and outcomes pertaining to economic impact and market performance hang in the balance, we are convinced that trying to time these events in any manner becomes a fool’s errand. Accordingly, we continue to maintain a prudent approach to your asset allocation, maintaining quality holdings of well-run companies at reasonable prices to help mitigate market volatility and continue to provide long-term growth.
Please take some time to review your updated report and should you have any questions or concerns, of course feel free to call. Also, if anything has changed regarding your current finances or objectives moving forward, let us know and we will make any appropriate updates and adjustments to your plan as needed. As always, we consider it an honor and privilege to work alongside you with your wealth management and look forward to doing so for many years to come.
Kindest regards,
Michael Brocker
MSFS, CLU, ChFC, AEP®, AIF®
Chartered Financial Consultant
Masters of Science in Financial Services
Matthew Brocker
MSFS, AEP®, RICP®, CAP®, AIF®
Masters of Science in Financial Services
Josh Brocker
CFP®, AIF®