Dear Client,
Hoping you and your loved ones are enjoying the first signs of spring and all the warmth and flourishing this time of year has to offer. We “survived” another quarter where new headlines just kept coming at a frenetic pace, and volatility within the equity markets responded accordingly. Since the first of the year the VIX index, which measures market volatility, has been uncharacteristically active. The index exceeded twenty for twelve straight trading sessions, marking the most volatile stretch in more than two years. The equity markets, as measured by the S&P 500, were down 4.3% for the quarter.
The Economy
As we have stated multiple times in the past, markets show the greatest levels of fluctuation during cycles where economic uncertainty abounds. Political and geopolitical stressors, legislative actions, executive orders, and tariff negotiations have all caused a heightened level of uncertainty, impacting the markets. While this provides for a more “interesting” journey, it seems analysis of the actual economic data is prudent.
The good, the bad, and the…uncertain?
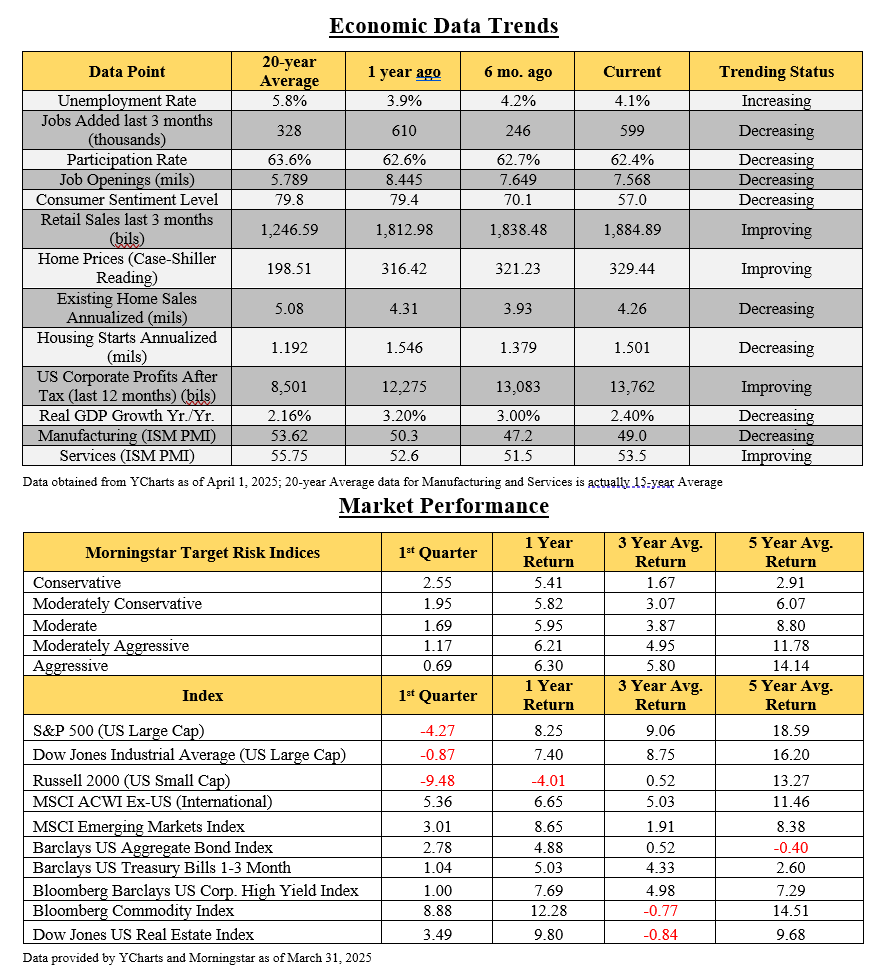
We will start with the bad news first. We continue to pay close attention to inflation as the most recent report of 2.8% was slightly above expectations, although still close to the Fed’s long-term 2% target. Housing starts have also softened over the last year, although still approximately 25% above the 20-year average. Manufacturing and Services indices remain somewhat lackluster as they have been for the last couple of years.
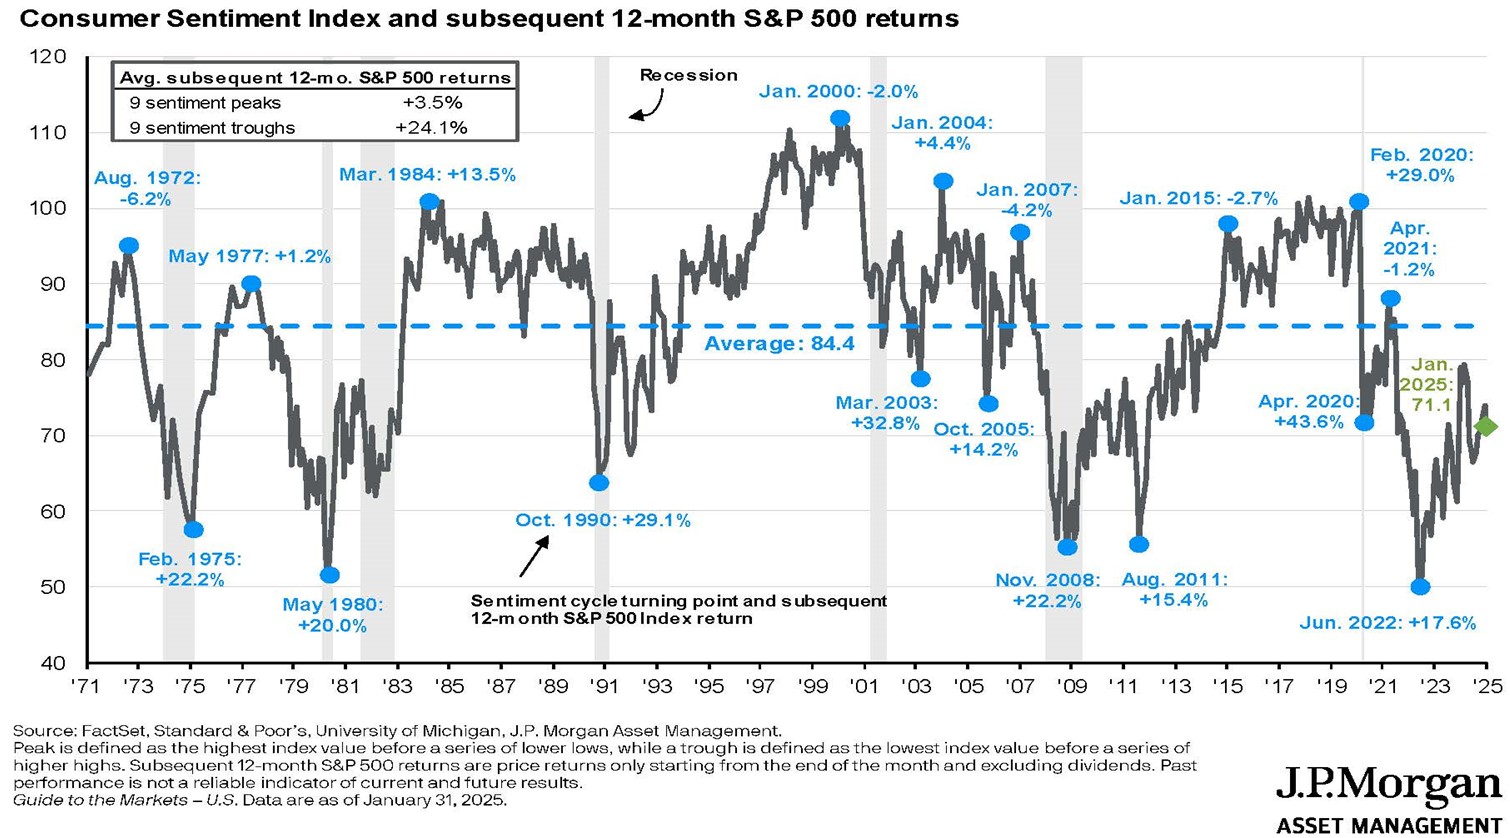
A more significant indicator of concern is Consumer Sentiment, which has fallen from 79.4 a year ago to a reading of 57 most recently. This tells us that consumers’ general outlook isn’t nearly as optimistic as it has been in times past. However, it is probably worthwhile to note that historically, the market has provided very favorable returns over the 12 months following a valley in Consumer Sentiment as indicated by the graph on the following page. This may be due to Consumer Sentiment having a recency bias toward the most recent economic and market data, as opposed to being a good indicator of market performance moving forward.
As it pertains to the good, in general, many leading indicators are still favorable when compared to a year ago, and to their 20-year averages. Unemployment remains low, and job openings are still at historically high levels. Lower energy prices, strong retail sales, corporate profits, and home values also provide some encouragement, yet the uncertain still lingers as the biggest concern for investors.
The frenetic pace of the new administration seems to keep the market and investors guessing on the impact these changes will have in both the near and long term. Tariffs have been a key determinant creating volatility and, although it seems logical that tariffs should result in higher inflation, it remains to be seen if the longer-term impact on US companies and the economy, in general, can help offset the potentially higher cost of foreign goods. There is a hope here as well that as energy prices continue to come down, this will help offset the higher cost of goods from other countries, which again, remains to be seen.
There are many other uncertainties abounding that include but are not limited to the extension of the 2017 tax cuts, geopolitical unrest, future executive orders, and tomorrow’s headlines in general. While all these things do matter, and may cause short term volatility, weathering uncertainty has always been, and will always be, an important part of the long-term success of the patient investor.
The Markets
We would be remiss if we didn’t acknowledge the five-year anniversary of the Covid drawdown in which the S&P 500 dropped 35% between Feb. 19 and March 23 of 2020. At that time, we sent multiple communications to help navigate that very uncertain phase. Although it was a time of unprecedented volatility, holding the course definitely proved beneficial. You may remember a chart we shared at that time depicting average market returns post bear market drawdowns.
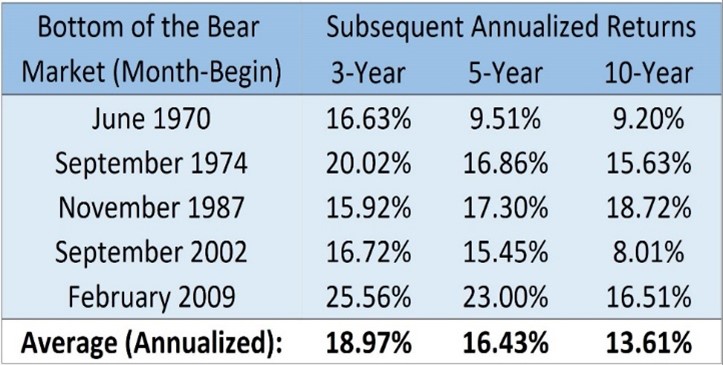
Drum roll please…Since the low in March of 2020 the S&P 500 has returned 171% and averaged over 21% per year over the last five years, which is consistent with what we have seen in the past. Why do we share this? Because during the market “storms” it can be very unsettling and there is a risk in letting emotions drive our financial decisions. However, history has shown, regardless of the reason for the volatility, that markets tend to grind higher over time, and historically provide some of the strongest returns after the periods of greatest uncertainty.
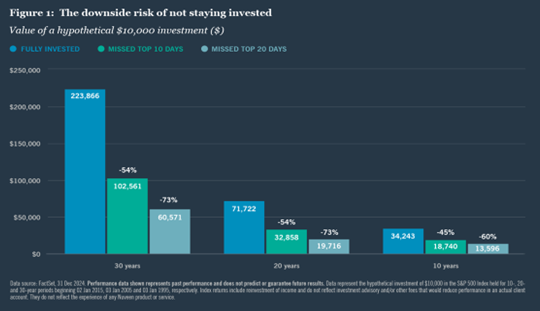
Another helpful analysis regarding market volatility and the risks of timing the market are depicted in the following graph. As you can see, the potential of missing only a few of the best days of the market over extended periods of time can have an extreme impact on returns.
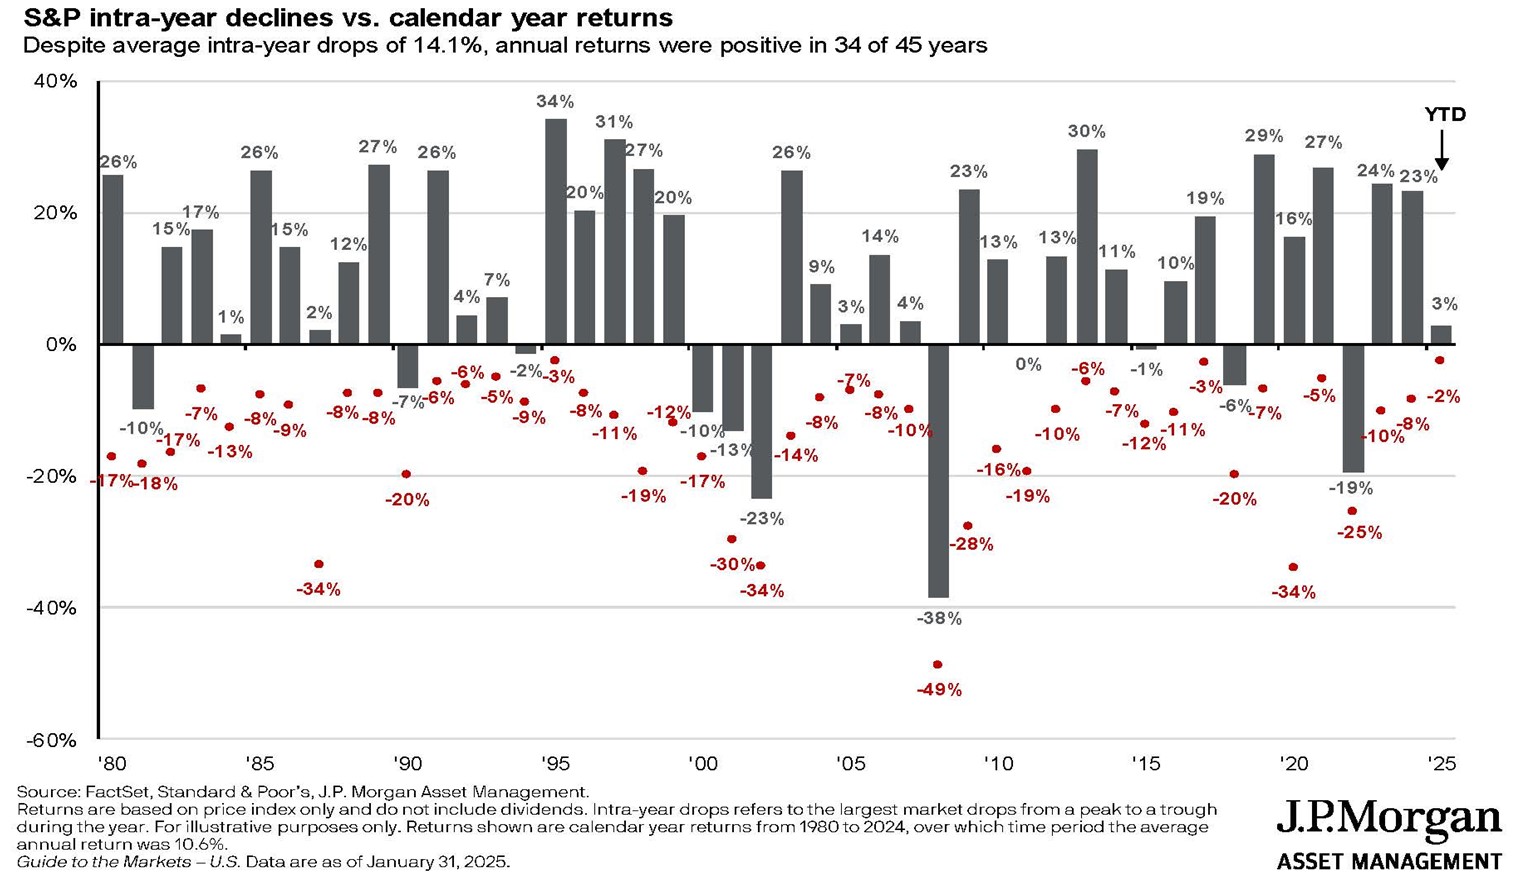
Another graph, which remains a good reminder of market behavior, shows the average intra-year decline in the equity markets (S&P 500) of 14% per year over the last 44 years. However, the average total return of the equity markets during that same period is 10.6%.
Portfolio Updates
We have touched on the fact that the largest stocks of the S&P 500 have provided most of the return in the large cap space over the last couple of years. This has subsequently changed in the first quarter, with broader diversification not only helping reduce risk, but also enhancing our results YTD. Also, our overall manager performance continues to be very solid vs. their relative indices, and although actual results have been lackluster, we have been encouraged with your results vs. the appropriate blended benchmarks.
As a quick update regarding our ADV (as required by the SEC), we have made no changes from the previous year, and our ADV and CRS forms can be found on our website if you would like to review them further. We would also be happy to provide a hard copy upon request. Additionally, you can find our Privacy Policy enclosed here.
As always, we want to make sure your portfolio is allocated in a manner consistent with your income needs and longer-term objectives for growth. This allows us to not only assure you of the income you need during volatile cycles but hopefully garners greater peace of mind for you as well. It also allows for shrewd rebalancing to optimize your overall long-term results.
If anything has changed pertaining to income needs or objectives, please let us know. Also, please take some time to review the enclosed update and should you have any questions or concerns, we look forward to hearing from you. We consider it an honor and a privilege to be working with you and look forward to helping with your wealth management for many years to come.
Kindest regards,
Michael Brocker
MSFS, CLU, ChFC, AEP®, AIF®
Chartered Financial Consultant
Masters of Science in Financial Services
Matthew Brocker
MSFS, AEP®, RICP®, CAP®, AIF®
Masters of Science in Financial Services
Josh Brocker
CFP®, AIF®