Dear Client,
Hoping you and yours enjoyed a wonderful summer and that you are doing well as we enter the last quarter of 2023. As projected, the theme of uncertainty surrounding the economy, equity markets, political, and geopolitical tensions have continued to carry the narrative in the headlines thus far. Amid multiple struggles portrayed through the various media sources, markets have continued to grind higher, albeit amid predictable volatility we have come to accept as the “new normal”. In the last 5 years we have experienced 3 bear markets (a drop of 20% or more), which is unprecedented, and the market resiliency has still managed to provide positive returns through that cycle.
The Market
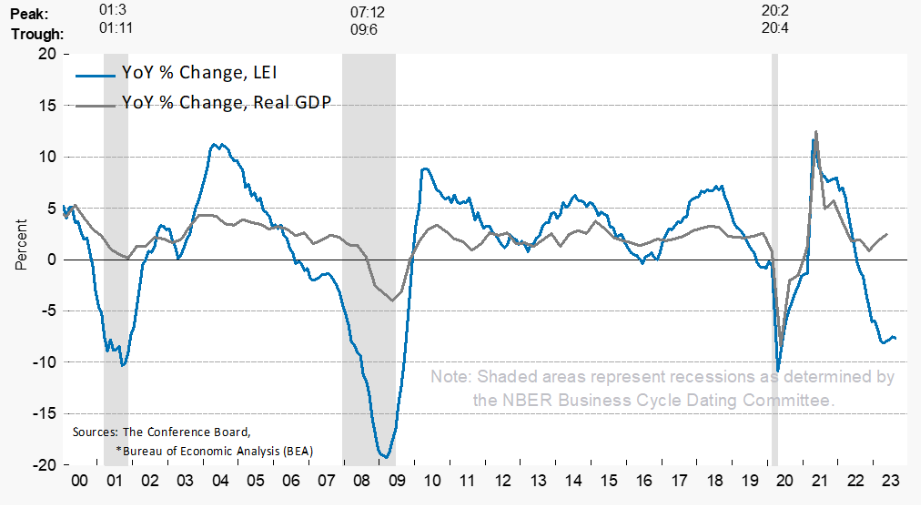
Markets have continued to provide reasonable growth over the past few years, driven primarily by US large cap tech stocks. Growth stocks have handily outperformed value, and although small and mid-cap stocks have outperformed large caps going back almost 100 years, larger companies have led the charge through this cycle. While we have definitely benefited from the growth we’ve experienced, based on some of the economic factors outlined below, we continue to adhere to broad diversification among style, size, and sector weightings, favoring higher quality companies. We believe this positions us well as we move forward when considering current valuations and the potential “slowing” of the economy on the horizon. The following is an update of the various Leading Economic Indicators, or the LEI Index. Alongside the LEI is the GDP data, which has not really taken the hit we would have expected based on the LEI Index, but we believe there is a reason for the lagging impact on the economy, which still may play out over the months ahead.
Economy
The three biggest drivers on the economy over the past 3-4 years have been as follows:
1. The $4.3 trillion in stimulus programs, which increased our money supply by 37% over 18 months.
2. The subsequent inflation we’ve experienced through the devaluing of our currency and limited supply channels.
3. Then finally the impact of the Fed’s torrid pace of rate increases to try and stave off inflation as much as possible.
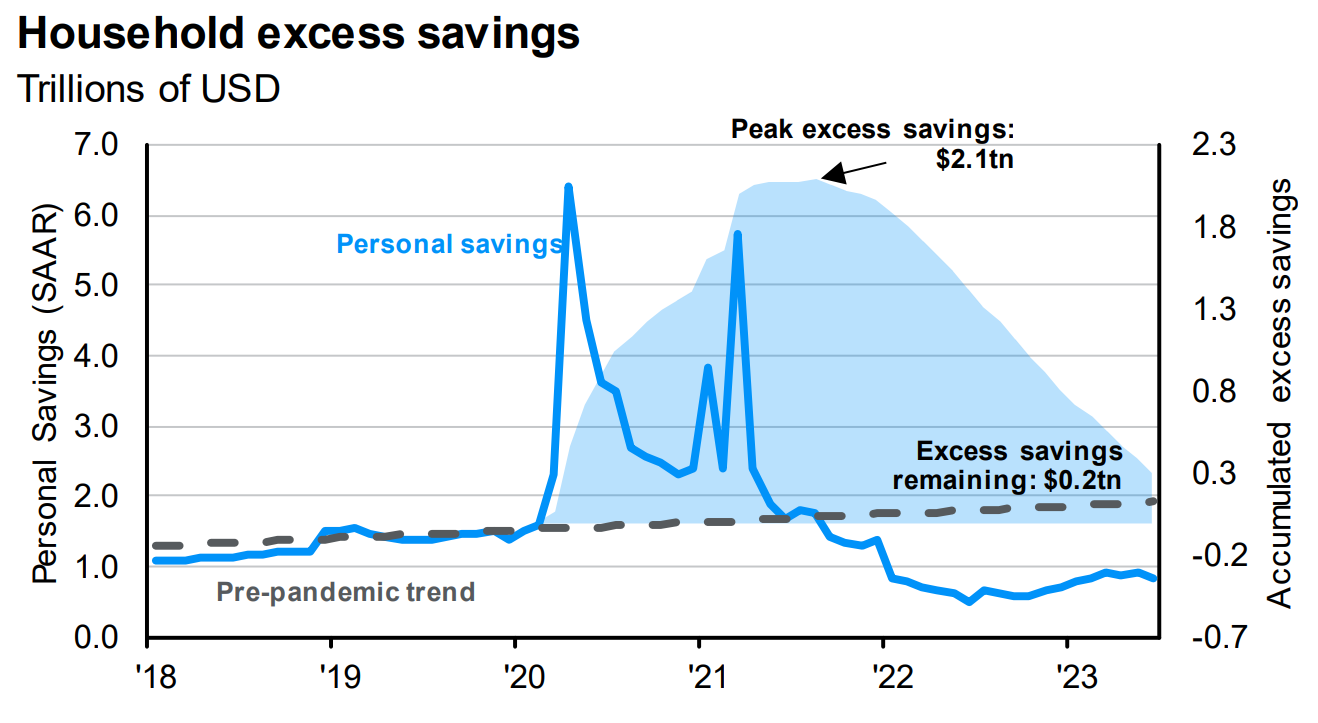
The following graph depicts the effect of the stimulus programs on household savings and “excess savings”, which have continued to dwindle alongside savings rates. Combining this reality alongside an ever-increasing average household consumer debt balance causes some concern as to the impact on the economy over the next couple of years. Historically, after excess savings diminish, savings rates go down, and debt balances rise, consumer spending shrinks. We believe this may have a ripple effect throughout the economy, impacting corporate profitability, housing, employment, manufacturing, and the services industry. Accordingly, we believe holding quality companies across multiple sectors should help to not only mitigate this potential volatility, but also provide exposure to market sectors that will weather this cycle, and hopefully generate continued growth as well.
Portfolio
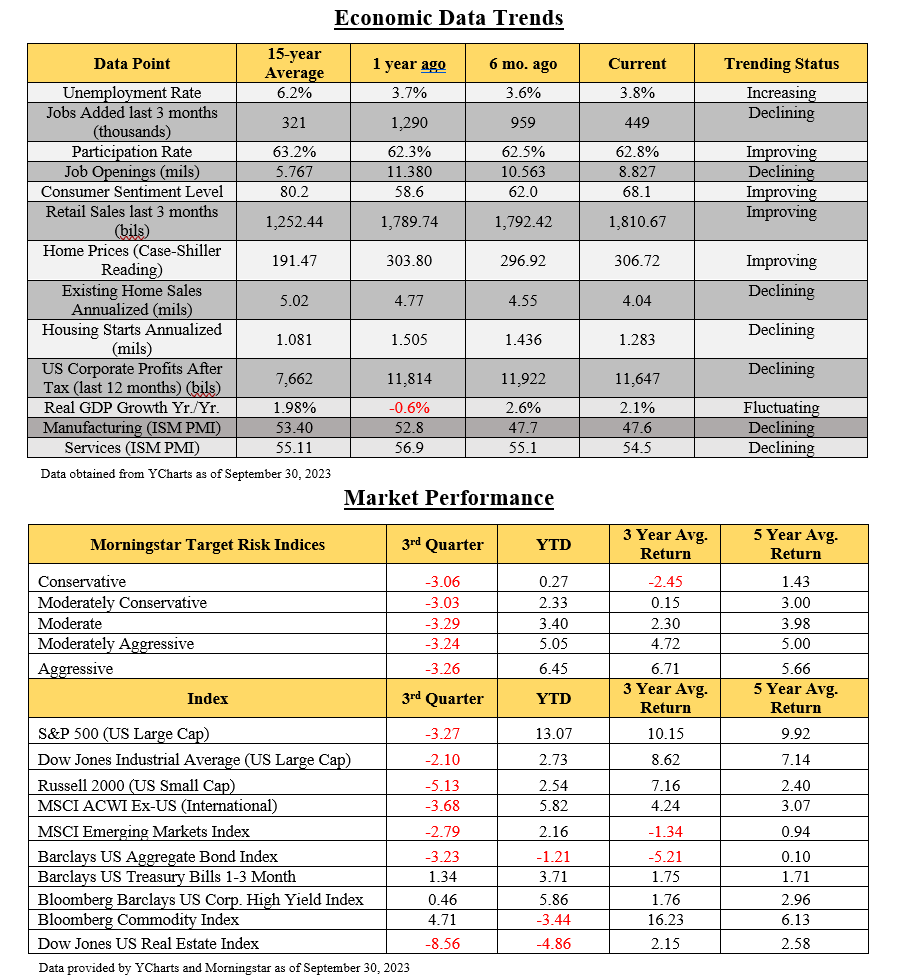
Reviewing your most recent manager performance report, we continue to be encouraged with the long-term performance of the various managers we have engaged in managing your portfolio. When compared with the appropriate Morningstar Target Risk benchmarks since transitioning custodians in early 2020, we have continued to see strong results with your current strategy whereby we are not recommending any changes at this time.
Ongoing
We are continuing to provide ongoing rebalancing as appropriate to optimize asset allocation, buying low and selling high. As we enter the fourth quarter, we continue engaging opportunities for tax loss harvesting as well. As you feel led to initiate any year end giving, please let us know, and we will make sure we are being as strategic as possible in utilizing low basis shares of stocks to minimize future long term capital gains as much as possible. Please take some time to review your enclosed update, and if anything has significantly changed regarding your current finances or objectives moving forward, please let us know.
As always, we consider it an honor and privilege to be able to serve you and look forward to doing so for many years to come.
Kindest regards,
Michael Brocker
MSFS, CLU, ChFC, AEP®, AIF®
Chartered Financial Consultant
Masters of Science in Financial Services
Matthew Brocker
MSFS, AEP®, RICP®, CAP®, AIF®
Masters of Science in Financial Services
Josh Brocker
CFP®, AIF®