Dear Client,
We hope this update finds you and your family doing well and enjoying all that the warm summer months have to offer. As we close out the first half of the year, we look back on another quarter of patchy growth with divergent returns among the various sectors that make up “the market”. It has been encouraging to see the various equity markets grind slowly higher throughout the first half of the year, but looking under the hood of how the growth has occurred reveals some unexpected deviations.
The Market
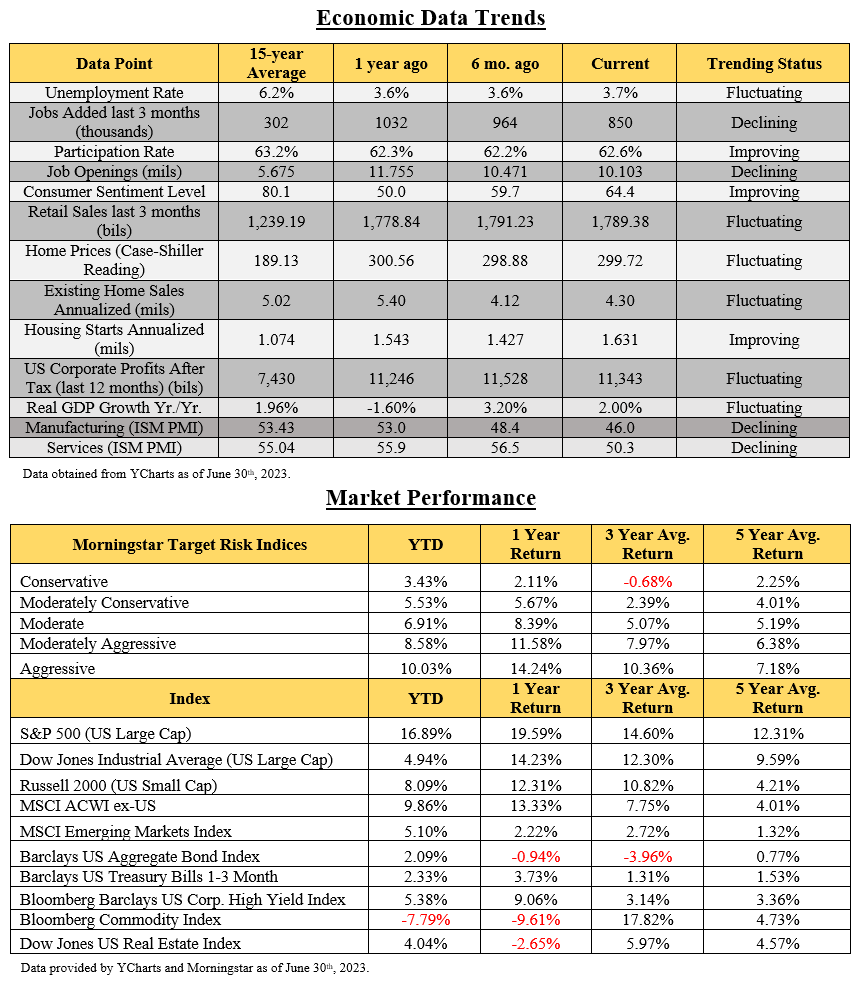
Some of the largest tech stocks, now referred to as FAATMANN (Facebook, Apple, Alphabet, Tesla, Microsoft, Amazon, NVIDIA, and Netflix) have collectively risen by over 50% year to date, propelling the S&P 500 to a total return of 16.89% for 2023. On an equal weighted basis, the S&P 500 (using the Invesco S&P 500 Equal Weight ETF, ticker RSP) is up only 3.92%. These 8 companies represent less than 2% of the holdings in the index but represent almost 30% on a cap weighted basis. Compared to a diversified portfolio that is not heavily weighted towards these 8 stocks, it is expected the index would significantly outperform in this unusual market. These 8 stocks are now trading at an average PE ratio of over 40, which is twice the average for the index itself, and which is higher than we would like to see when potentially entering an economic slowdown, or recession. The other 492 stocks of the S&P 500 are trading at an average PE in the high teens, which is much more in line with long term historical averages.
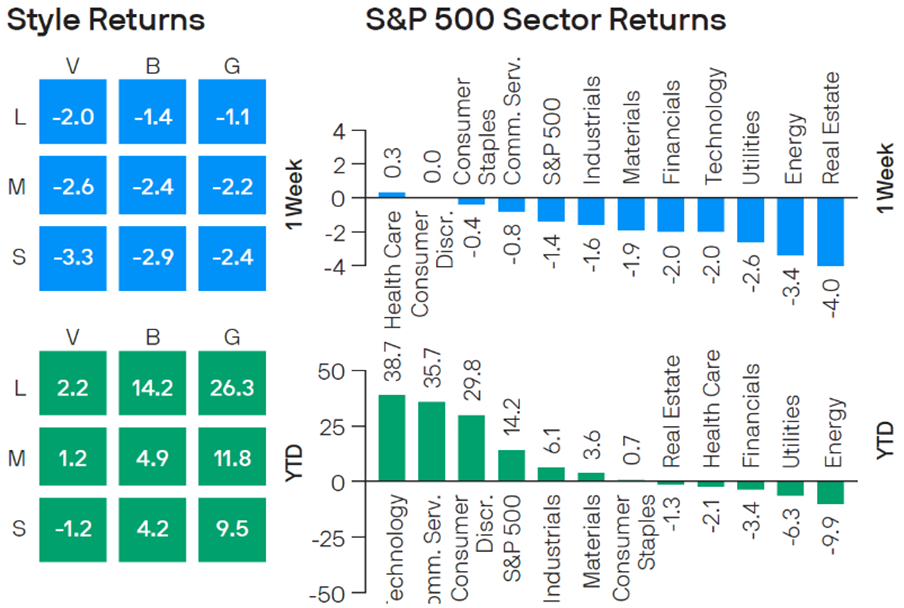
We also find it interesting that dividend stocks have had their worst relative performance to the broader markets since 1999, and value stocks have also underperformed, with large cap growth stocks up over 29.02% YTD and large cap value stocks returning just 5.12%. Accordingly, some of the most conservative sectors, where we find many dividend and value stocks which typically have stronger downside protection during volatile cycles, (Energy, Utilities, Financials, Health Care, Consumer Staples, Materials, and Industrials) are struggling to eke out positive returns, while the technology sector has made a strong recovery from the abysmal returns in 2022.
The Economy
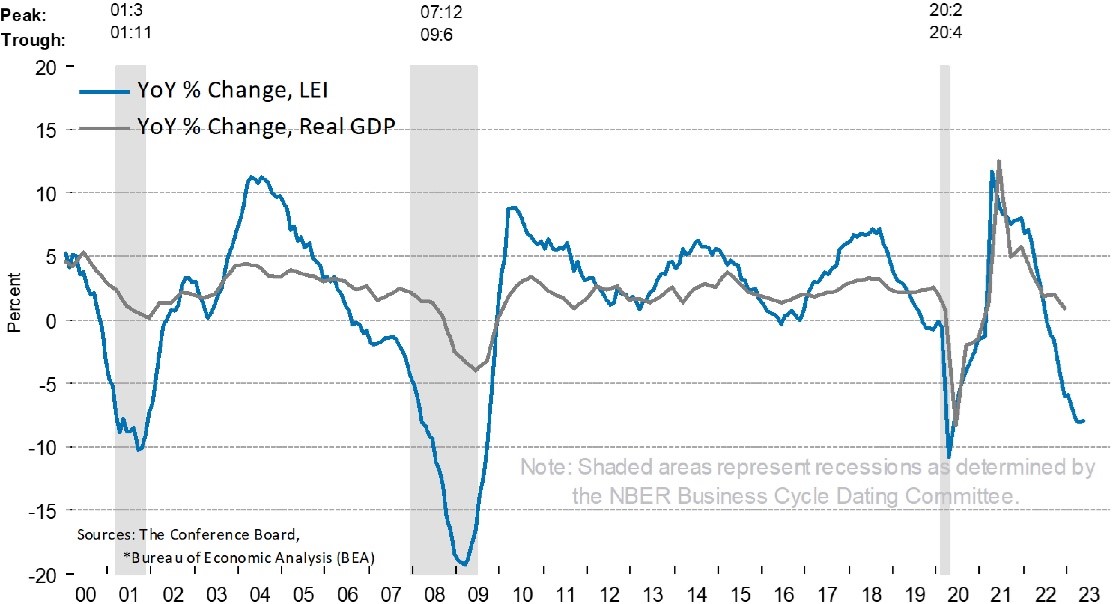
While there have been some bright spots in the economy with the Fed pressing the pause button last month on their aggressive increases to interest rates, and housing starts showing a surprising increase, we have come to expect that an economic slowdown, or even recession is on the horizon. The Conference Board’s leading Economic Indicator (LEI) Index just had its 14th consecutive month of decline and is now off almost 10% over that period. The last three times that it dropped at least 10%, as noted on the graph to the right, were in 2001, 2008-09, and 2020 during Covid. According to an analysis done by Ladenburg Thalmann Asset Management, the average return of the stock market over the 12 months after the precipitous decline in the LEI Index was over 23% per year (going back to LEI’s inception in 1959). While there is no guarantee of future performance, it is encouraging to note that after a large drop-off in leading indicators, the market typically follows with strong returns as we move forward.
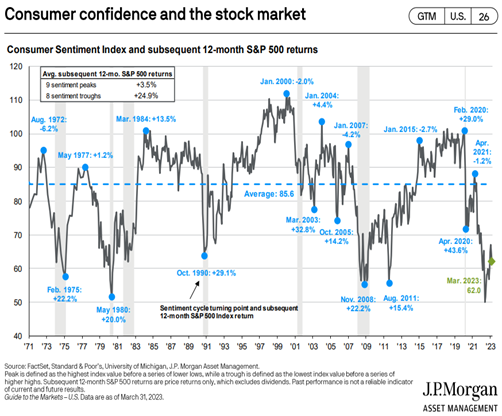
Another metric that is a factor in the LEI Index is Consumer Sentiment, which recently hit another trough as indicated in the graph to the left. Once again, you would think that the consumer outlook is bleak, the subsequent market performance would be discouraging, however it is just the opposite, going back over 40 years. As you can see, after high points or “peaks” in consumer confidence, the market has averaged just over 3% over the next 12 months, while averaging over 24% after the troughs. Again, this doesn’t guarantee anything, but it appears to confirm that holding the course through economic uncertainty and a negative outlook appears to pay off for the patient investor.
Your Portfolio
While this has clearly been a challenging cycle for a diversified portfolio that adheres to high quality, reasonably valued companies with strong leadership and good balance sheets, we have been encouraged by the performance we have seen when compared with the appropriate blended benchmarks. We are also even more confident that our current holdings and management philosophy will bode well for us as the aforementioned uncertainty plays out over the months and years ahead, whether we go through a predicted soft patch in the economy or move forward with continued slow growth.
Please take some time to review your enclosed update and should you have any questions or concerns regarding any of the information provided or mentioned above, please feel free to call. As always, we consider it an honor and a privilege to be working with you on your planning and look forward to doing so for many years to come.
Kindest personal regards,
Michael Brocker
MSFS, CLU, ChFC, AEP®, AIF®
Chartered Financial Consultant
Masters of Science in Financial Services
Matthew Brocker
MSFS, AEP®, RICP®, CAP®, AIF®
Masters of Science in Financial Services
Josh Brocker
CFP®, AIF®