Dear Client,
We hope this update finds you and yours doing well as you reflect on warm summer memories and look forward to what hopes to be a beautiful autumn. After officially reaching bear market territory back in June, the equity markets rallied over 17% over the next two months, only to swoon again over the last few weeks back into bear market territory. For the year, most of the major equity indexes are now down over 20% and the bond markets as are actually down 14.61% from Jan 1.1 The bond market losses in value are due to multiple rate increases instituted by the Federal Reserve in an effort to squelch inflation, while hopefully not slowing growth too much, or pushing the economy into a deeper recession.
1Data obtained from YCharts as of June 30th, 2022
Economic Update
After increasing rates 75 basis points two weeks ago, the Fed’s aggressive stance on interest rates is expected to continue through the end of the year. Market expectations are assuming a 75 basis point increase in November and another 50 point increase in December. The Fed’s objective is to bring inflation down to the 2-3% range by the end of 2023. They are continuing to press forward in this direction realizing the fallout from their aggressive stance against inflation will negatively impact corporate profits, employment, consumer confidence, housing, and overall business activity due to the higher cost of borrowing.
Whether you believe we are already in a recession, or possibly heading into one, the real question seems to be where we go from here. It seems logical that the Fed’s objective of slowing economic growth is going to play out over the next several months. It also appears the market may be pricing that future slowdown into current market valuations based on the recent selloffs we have seen. The hope is that the inevitable slowdown will be both small in size and short in duration, whereby the Fed can stave off inflation without pushing the economy over the edge. If accomplished, ideally this would move us back to a slow growth, low inflation, low interest rate environment, which historically has proven to be very profitable for patient investors.
Market Outlook
As we evaluate the uncertain terrain and the impact of Fed policies over the next several months, there are a number of factors that we are taking into consideration that encourage us to hold our course through this rough patch of uncertainty with the best possible outcome for your long-term planning objectives.
Valuations
As with many market downturns, equity valuations have been pushed down below their 25-year averages. In other words, quality stocks appear to be relatively inexpensive. Looking historically, after periods of undervaluation, equity markets tend to provide stronger average returns over the next 5 years.2 Along the same lines, average market returns after reaching bear market status have also been very strong over the next several years. Even more so, recoveries from the bear market bottoms have averaged over 13% for 3, 5, and 10-year periods as reflected by the table below.3 Although we may not have hit the bottom of this bear, our inability to accurately predict when we hit bottom encourages us to stay on course for the best outcome.
2JPMorgan Guide to the Markets Hune 30th, 2022 (pages 6 and 12)
3All Financial Matters March 31, 2020
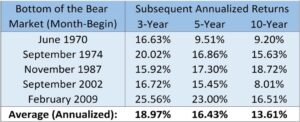
Data from All Financial Matters, March 31, 2020
Market Performance During Recessionary Periods
As a leading indicator of an upcoming recession, equity markets many times will see their greatest corrections before actually entering into a recession. Since the Depression, average market returns during recessions have surprisingly yielded positive returns. Accordingly, if you could have timed every recession perfectly, getting out on the first day of the recession, and back in on the last day you would have averaged 10.6% vs. 11.7% simply holding the course through the recession.4
4How to Think About Investing During a Recession by Charlie Bilello
Economic Indicators
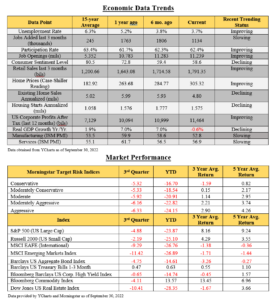
Although a slowdown is evident and already beginning to play out, many leading indicators appear strong enough to weather a hopefully mild pull back. Corporate profits and housing starts are both still 40% ahead of their 15-year averages, and the JOLT Index (job opportunities) is at 200% of the 15-year average. Unemployment has averaged 6.3% over the last 15 years and we are currently at 3.7%. We are continuing to add jobs at a rate that is 400% above the quarterly average of the last 15 years, and retail sales are still 20% above their inflation adjusted 15-year average.5 These economic realities are all likely playing a part in Chairman Powell’s aggressisve stance on rate increases, believing an economic “soft landing” is still achievable.
5Data from YCharts as of September 30th, 2022
Fixed Income Markets
Although a rising interest rate environment typically damages growth because of the impact on borrowing and the housing markets, there are some positives as well. One of the biggest positives as it pertains to your portfolio is that bond holdings that had previously been providing yields of 1-3% are now in the 5-7% range, which makes for a more favorable risk-reward relationship in fixed income holdings moving forward.
Portfolio Strategies
While it has obviously been a difficult year for equity markets, one of the most frustrating things in a rising interest rate cycle is what has happened to bond valuations, and correspondingly to moderately allocated (60/40) portfolios. Considering annual returns going back to 1928 of a portfolio allocated 60% to the S&P 500 and 40% in ten-year treasuries would be down over 20% YTD through 9/26/22, which has happened only two other times (1931 and 1937) in the last 94 years.6 It is encouraging to note that although moderate portfolios do incur losses periodically, in 79% of those 94 years this allocation provided positive returns, and the average annual return going back to 1928 has been 8.45%.7
660/40 Portfolio: S&P 500/US 10-Year Treasury (Total Returns, 1929-2022) by Charlie Bilello
7NYU Stern Historical Returns on Stocks, Bonds, and Bills:; 1928-2021
Rebalancing
As with all volatile periods in the market, we are continuing the discipline of buying low and selling high through strategic rebalancing where appropriate. This will help to both enhance returns and maintain proper asset allocation in line with your specific goals and objectives.
Tax Loss Harvesting
Although the obvious negative is that we actually have incurred losses in the portfolio, the positive is that we are taking advantage of the opportunities to harvest those losses to offset against realized capital gains for 2022, and future realized gains with capital loss carry forwards.
Legacy Portfolio Managers
We have continued to be encouraged with our selected managers and the strategies we have employed. Over 80% of our managers have continued to stay ahead of their indexes through Covid and during this recent Bear Market,8 which has been encouraging. Although our allocation to alternative strategies is lagging so far this year, we believe we are well positioned to benefit from those allocations moving forward.
8Data from Envestnet as of September 30th, 2022
Please take some time to review your enclosed updates, and should you have any questions of concerns, please feel free to reach out. If we have not heard from you, we will keep in touch. As always, we consider it an honor and privilege to help you with your planning and look forward to doing so for many years to come.
Kindest Regards,
Michael Brocker
MSFS, CLU, ChFC, AEP®, AIF®
Chartered Financial Consultant
Masters of Science in Financial Services
Matthew Brocker
AEP®, RICP®, CAP®, AIF®
Masters of Science in Financial Services
Josh Brocker
CFP®, AIF®
Securities Offered Through M Holdings Securities, Inc. A Registered Broker/Dealer, Member FINRA/SIPC. Investment Advisory Services Offered Through Legacy Wealth Asset Management, LLC. Legacy Wealth is independently owned and operated. This material is intended for information purposes only and should not be construed as legal or tax advice and is not intended to replace the advice of a qualified attorney, tax advisor, or plan provider. Investments in securities involve risks, including the possible loss of principal. When redeemed, shares may be worth more or less than their original value. The Standard & Poor’s 500 Index (S&P 500 TR) is an index of 500 stocks chosen for market size, liquidity and industry grouping, among other factors. The S&P 500 is designed to be a leading indicator of U.S. equities and is meant to reflect the risk/return characteristics of the large cap universe. The Barclays US Aggregate Bond Index is a broad-based flagship benchmark that measures the investment grade, US dollar-denominated, fixed-rate taxable bond market. The index includes Treasuries, government-related and corporate securities, MBS (agency fixed-rate and hybrid ARM pass-throughs), ABS and CMBS (agency and non-agency).The Purchasing Managers’ Index (PMI) is an index of the prevailing direction of economic trends in the manufacturing and service sectors. It consists of a diffusion index that summarizes whether market conditions, as viewed by purchasing managers, are expanding, staying the same, or contracting. The purpose of the PMI is to provide information about current and future business conditions to company decision makers, analysts, and investors. The Composite Index of Leading Indicators, otherwise known as the Leading Economic Index (LEI), is an index published monthly by The Conference Board. It is used to predict the direction of global economic movements in future months. The index is composed of 10 economic components whose changes tend to precede changes in the overall economy. The Conference Board, founded in 1916, is an independent research association that provides its member organizations with economic and financial information. Northern Trust is the owner of any trademarks, service marks and copyrights related to its respective indexes. Index Data is provided by Thomson Reuters, Interactive Data Corporation, and Northern Trust Index Services. Performance returns are shown as Total Return or Net Total Return depending on whether the index universe is inclusive of US or non-US securities. Northern Trust’s publication of the Northern Trust Indexes in no way suggests or implies an opinion by Northern Trust as to the attractiveness or appropriateness of investments in any or all securities upon which the Northern Trust Indexes are based. These examples are for illustrative purposes only, an investor cannot invest in an index. Commentary regarding the returns for investment indices and categories do not reflect the performance of Legacy Wealth, or its clients. Historical performance results for investment indices and/or categories generally do not reflect the deduction of transaction and/or custodial charges or the deduction of an investment-management fee, the incurrence of which would have the effect of decreasing historical performance results. File #4974693.1